Data-Driven Safety in Food & Agriculture
Despite advances, the Australian food, beverage, and agriculture sectors continue to experience safety challenges. This article presents a data-driven approach to transform safety culture and empower employees. It highlights how giving workers access to and training on safety data facilitates a shift from a "compliance" culture, where rules are followed passively, to a "commitment" culture, where individuals are motivated to take personal responsibility for safety.

From Safety Metrics to Motivation:
Using Data at the Frontline Empowers Decision Making
Australian food, beverage and agriculture companies have a lot on their plates. As they seek to efficiently produce and market new products, pressure continues to mount on multiple fronts. Consumers are demanding ever-higher quality and greater sustainability. Extreme weather and political challenges affect pricing and supply chains. And, despite significant advances in worker safety, serious injuries, fatalities, and illnesses persist.
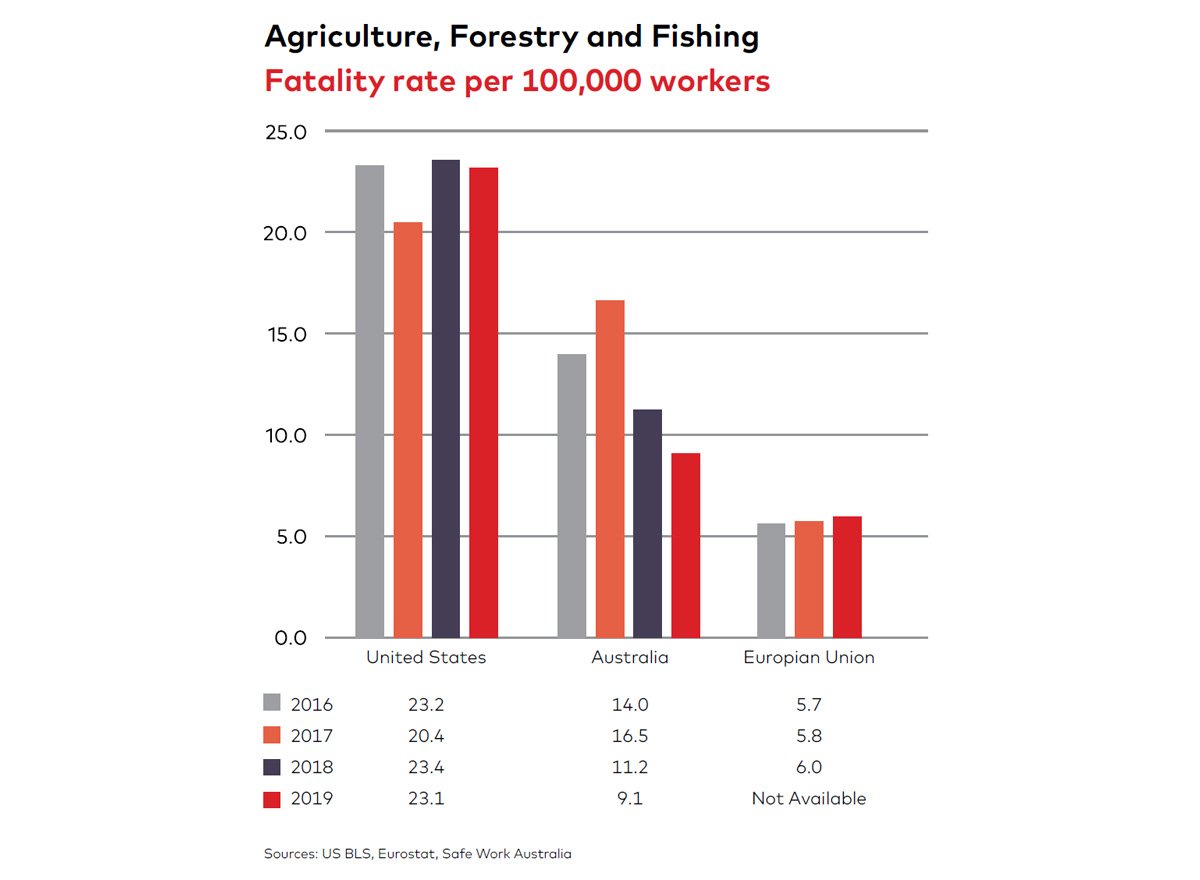
Data through 2019 shows that lost time injury frequency rates (LTIFR) in the agriculture, forestry and fishing sector are fairly consistent across Australia, the US and the EU, remaining constant from 2017‒2019. Fatality rates, however, vary more widely. Fatalities occurred in Australia at a far lower rate compared to the US, falling by 44% in the years 2017‒2019. However, the rate across 27 EU countries was consistently lower than Australia's.
2023 data from Safe Work Australia shows that the agriculture, forestry and fishing industry continue to have the highest fatality rate of all Australian sectors.
In a recent perspective on culture transformation, dss+ discussed the significant impacts on incidents and attitudes when a company progresses from a 'compliance' culture marked by a singular focus on following the rules to a 'commitment' culture in which people are motivated to take personal responsibility for safety, going above and beyond rule compliance. Now we'll share how utilising data helps make that positive shift possible.
(There are) significant impacts on incidents and attitudes when a company progresses from a 'compliance' culture marked by a singular focus on following the rules to a 'commitment' culture in which people are motivated to take personal responsibility for safety, going above and beyond rule compliance...utilising data helps make that positive shift possible.
Connecting Data to Safety
Providing access to safety performance data — and helping employees develop the skills to analyse and act on that data—can lead to important payoffs in how people think about safety in four key ways.
1. Identifying Patterns and Root Causes
Looking at trends in incidents, near misses, and operational inefficiencies can help employees recognise underlying causes. Engaging employees in this process allows them to generate ideas and take ownership of preventive actions. They also gain the ability to anticipate risks, building a more self-reliant culture.
Examples:
- Incident analysis—examining data from past events to identify patterns and unresolved causes
- Risk mapping—creating heatmaps of high-risk tasks or areas to prioritise interventions
2. Acting on Predictive Insights
Armed with data analytics and predictive modelling, individuals can look for ways to head-off issues before they escalate.
Examples:
- Risk forecasting—machine learning models can anticipate potential risks based on historical and trending data
- Preventive maintenance—equipment repairs can be scheduled based on usage data to avoid failures
3. Measuring and Recognising Progress
Using data to objectively track individual and team contributions towards safety and operational goals motivates and reinforces positive behaviour. Recognising data-driven approaches encourages others to follow suit, fast-tracking growth.
Examples:
- Behaviour-based observations—collecting data on and acknowledging proactive safety behaviours
- Performance dashboards—highlighting those who achieve incremental and significant improvements
4. Enabling Continuous Improvement
Collecting and analysing data creates a foundation for ongoing learning and adaptability. Employees involved in these efforts develop the mindset and skills required of a learning organisation—a key characteristic of a mature safety culture.
Examples:
- 'Embracing the red'—conducting regular reviews of safety and operational performance data, framing any negative trends as an opportunity to learn
- Team discussions—facilitating opportunities to interpret data, generate actionable insights and challenge the status quo
- Feedback loops—refining processes and policies based on data gleaned
Author